Comparing Profiler Runs


Introduction
For an existing application, especially one that has several features, a small change in data, environment, or code occasionally leads to unexpectedly different runtimes. The location in the code of that application, where these differences manifest themselves, is not always obvious. In such circumstances, comparing profiler results may be a useful next step to locate the code where the significant differences in runtimes manifest themselves.
Instructions
This chapter is divided into three sections:
Application Preparation
Making a run and downloading runs
Reading and comparing runs
Application Preparation
Inside the project you want to analyze performance, follow these steps.
Step 1: Add ProfilerStart to the beginning of MainInitialization.
Step 2: Add section downloadProfilerResults to the application using import section. You can download this file by downloading the full repository available on github.
Step 3: Add a download button on one of your WebUI pages.
Making a Run and Downloading Runs
In the next subsection, we will be comparing the results of runs made. Doing such a comparison, you don’t want to be distracted by differences that have a difference cause than the cause at hand.
For instance, when changing the cloud provider from AWS to Azure, the results should not be fogged by different database contents or different versions of the same application.
Reading and Comparing Runs
When you have two or more .profilerData.txt files, you can compare them using profilerRunCompare application.
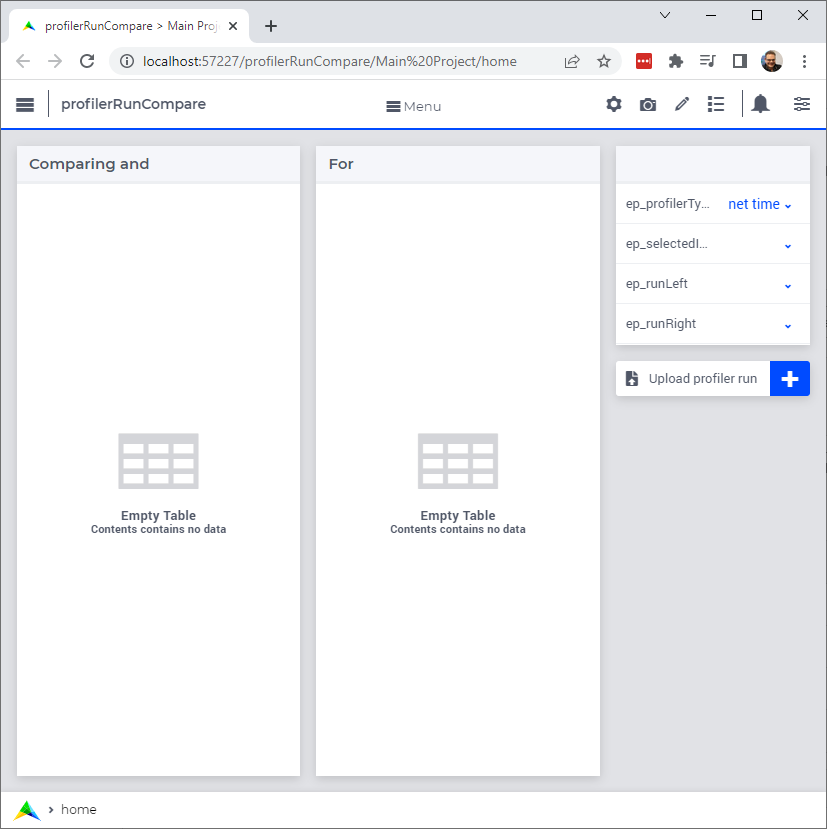
This app starts up as follows:

Now, you should:
Upload two
.profilerData.txtfiles.Assign one of the to
ep_runLeft, and the other toep_runRight.
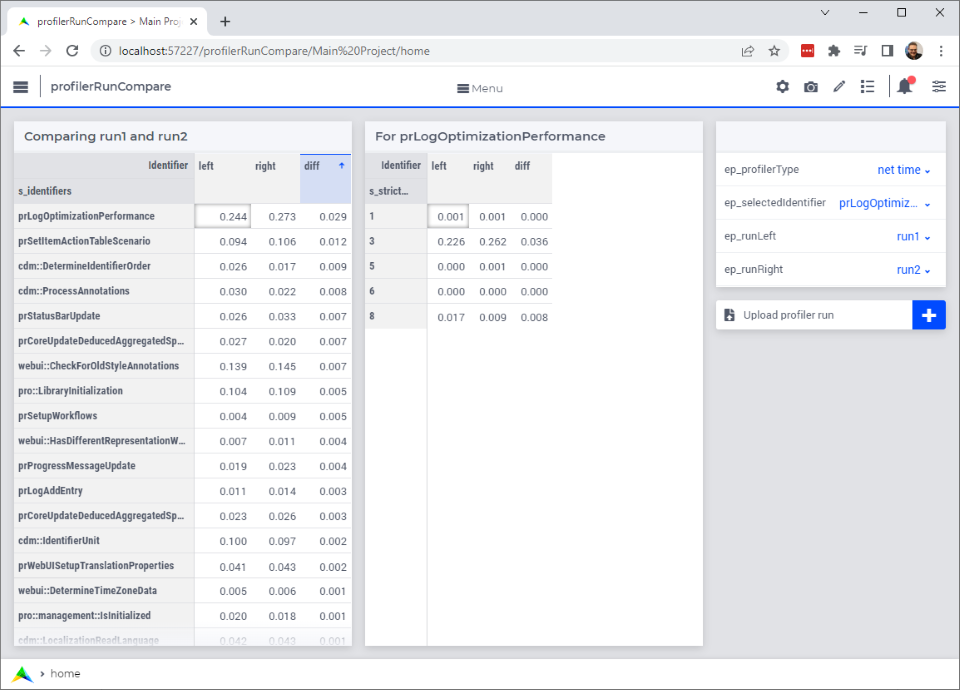
Then an initial comparison screen will show as follows:

Remarks:
Select an identifier by clicking in the data area of the first table.
You can select the profiler type in the upper right via the dropdown at
ep_profilerType.
Minimal Requirements
AIMMS Community license is sufficient for working with this example.