Comparing Schedules from Scenarios
We want to compare schedules from different scenarios. We use a flowshop model example, which you can download from the link below.
We’ll show the result for the end user, and how to achieve it as a developer.
Comparison as End User
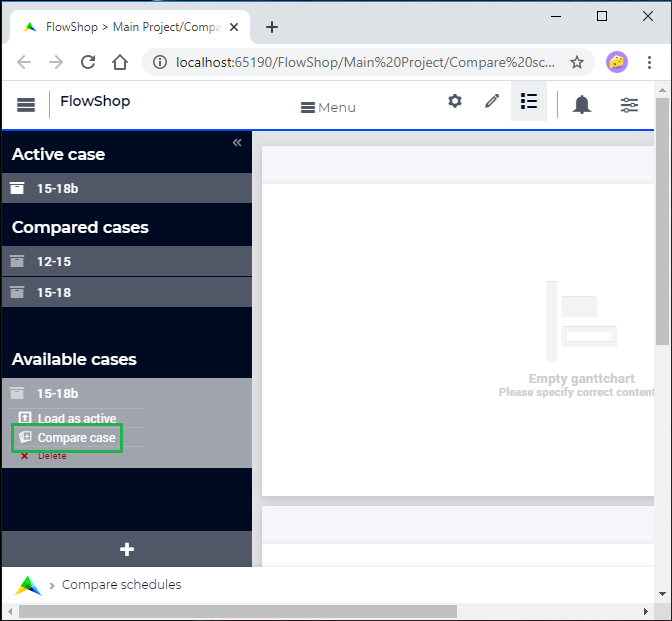
Select cases via data manager

Select an active case. For every case to compare, click .
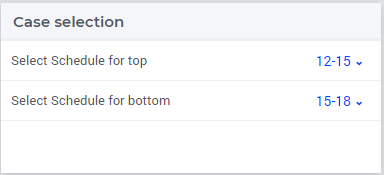
Select cases to show via scalar widget

Select a case to show in the top Gantt Chart, and one to show in the bottom Gantt Chart.
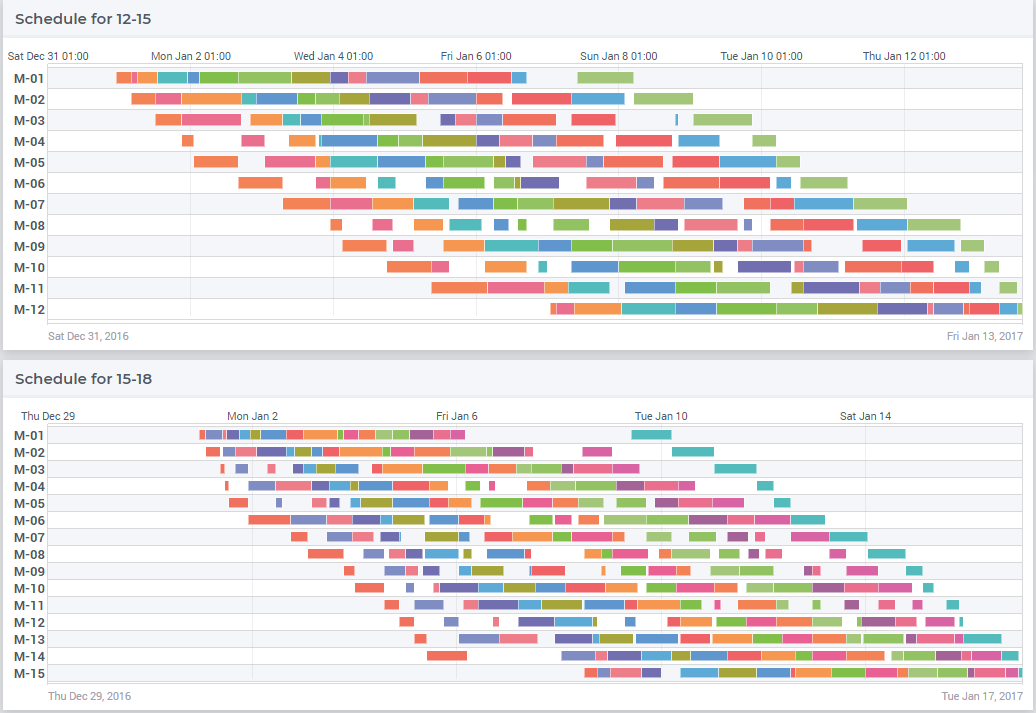
Compare schedules visually

The result is a visual comparison of schedules.
Developer Steps
Select cases to compare (two or more) and show the selected cases in a scalar widget.
Cache the information about the schedules in the model.
Create two WebUI Gantt Chart widgets.
The Gantt info is based on the cached info stored in second step.
Slice this information per Gantt Chart using the element parameters from the first step.
These steps are explained in detail below.
Select Cases to Compare
Use the predeclared set CurrentCaseSelection for all cases you selected to be compared.
Declare as follows:
Set CurrentCaseSelection {
    SubsetOf: AllCases;
    Text: "The set of cases selected from within the GUI";
    Index: IndexCurrentCaseSelection;
}
Note the index IndexCurrentCaseSelection; we will use this index below to declare data over all cases.
This set is filled using the dialog of the “Data Manager” tool of the AIMMS WebUI. Once a user filled this set, he can select the case for the schedule shown in the top Gantt Chart, and similarly, the case for the schedule shown in the bottom Gantt Chart.
This is simply a matter of element parameters selecting a value in CurrentCaseSelection.
The scalar widget, for elements in AllCases shows the case name; so we don’t have to do the number-to-name conversion ourselves here.
The element parameters are declared as follows:
ElementParameter ep_ReferenceTopCase {
    Range: CurrentCaseSelection;
}
ElementParameter ep_ReferenceBottomCase {
    Range: CurrentCaseSelection;
}
As we do not want to show such identifier names in the user interface, we use translation table MainProject\WebUI\resources\identifier-translation.properties with the following contents:
1ep_ReferenceTopCase = Select Schedule for top
2ep_ReferenceBottomCase = Select Schedule for bottom
Cache Data for Schedules
The WebUI requires identifier references for the start and duration of the Gantt Charts; that is data that is stored in the model. Thus we need to cache data from the cases selected to the model. The AIMMS modeling languages uses dot-notation to refer to data in cases as follows:
Parameter p_case_GCJobStart {
    IndexDomain: (IndexCurrentCaseSelection,j,m);
    Definition: IndexCurrentCaseSelection.p_GCJobStart(j, m);
}
Parameter p_case_GCJobDuration {
    IndexDomain: (IndexCurrentCaseSelection,j,m);
    Definition: IndexCurrentCaseSelection.p_GCJobDuration(j, m);
}
Here we see the index IndexCurrentCaseSelection again, varying over all cases in CurrentCaseSelection.
In the definition of these two parameters it is followed by a “.”; hence the name dot-notation.
The “.” is then followed by an ordinary identifier reference.
Using this definition, AIMMS will fill the parameters p_case_GCJobStart and p_case_GCJobDuration with the schedules stored in the case files.
Create Gantt Chart Widgets
Now we create the two Gantt Chart widgets, both with Gantt data:
Start:
p_case_GCJobStartDuration:
p_case_GCJobDuration
Using identifier settings on both these parameters, the index IndexCurrentCaseSelection is sliced using the element parameters ep_ReferenceTopCase and ep_ReferenceBottomCase for the top and bottom Gantt Chart widgets respectively.
This should give the desired result as shown at the end of our user story.
See also
AIMMS The Language Reference, search for “Case referencing” in Lexical Conventions