Sailing Across the World
A global maritime route consists of multiple waypoints (nodes) and legs (arcs). When visualizing these routes in a map interface, handling the “seam” of the world map, where longitudes transition from 180° to -180°, is a common challenge.
This article demonstrates how to create a seamless sailing route using the AIMMS WebUI Map widget, ensuring that waypoints and connections remain visible and logically connected even as you scroll across the globe.
Please refer to the Vessel Scheduling example example to follow along with this article.
Visualizing the Route
To provide a continuous experience, the map widget allows horizontal scrolling across the equator.
Open Vessel Scheduling example, load the 503-article case, and navigate to the “Visualizations” page.
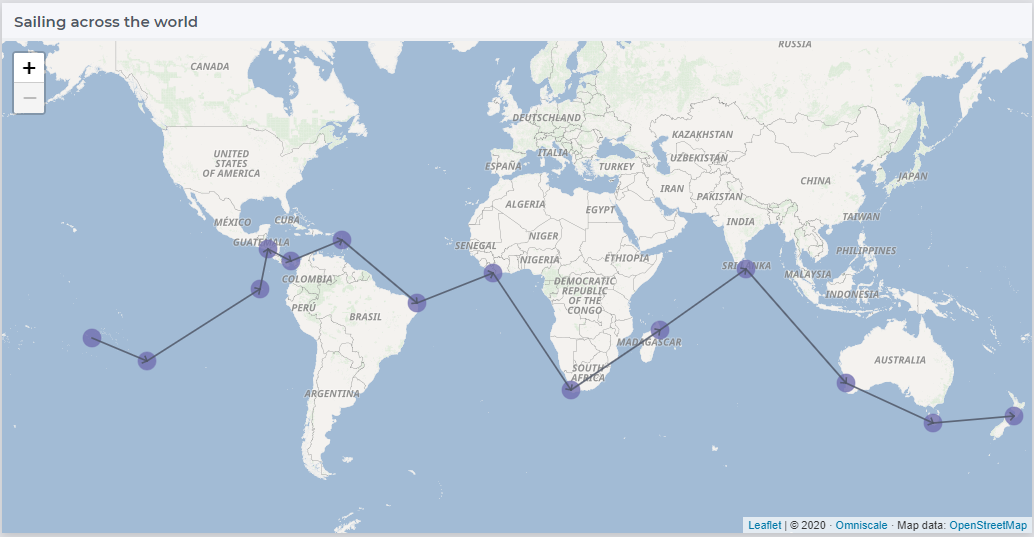
The initial view focuses on one side of the hemisphere:
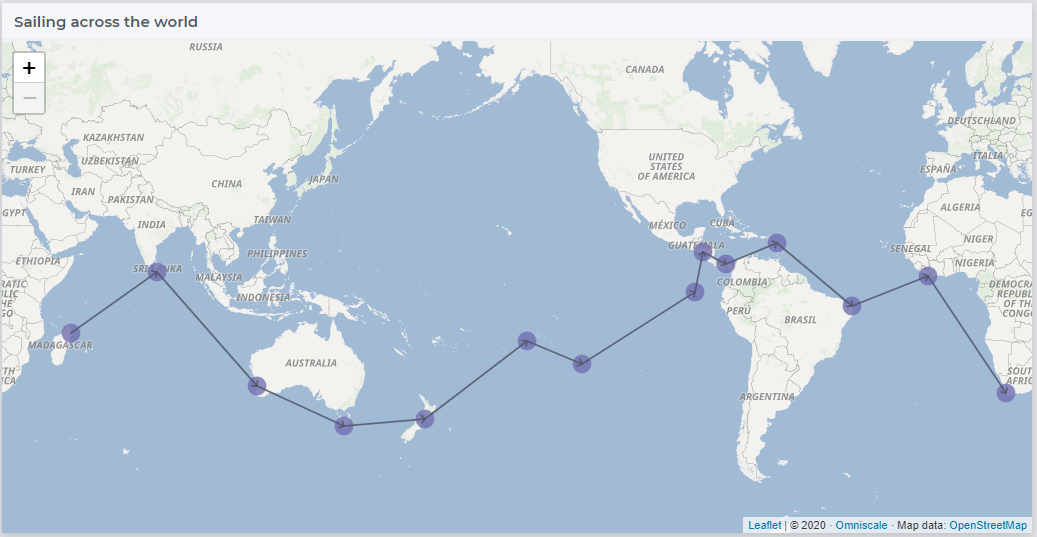
After scrolling approximately 180 degrees to focus on the opposite side of the planet, the route dynamically adjusts to stay within the viewport:
Design Strategy
As the user scrolls horizontally, waypoints might “fall off” one edge of the map.
To keep them visible, we must adapt their longitude values so they stay within the current viewing range: [center longitude - 180, center longitude + 180].
However, adapting longitudes creates a secondary issue: since the route is circular, a connection between a waypoint at the far left edge and one at the far right edge would result in a long, distracting line stretching across the entire map. To prevent this, we implement logic to hide arcs that span too large a longitudinal distance (the “backside” of the map).
Implementation
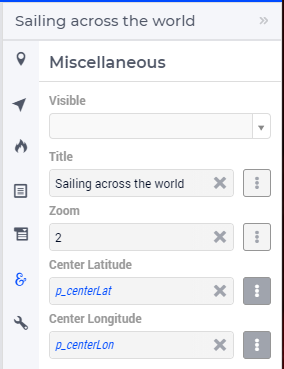
To synchronize the model with the UI, we first capture the map’s current perspective (center latitude and longitude):
Step 1 - Adapting Waypoint Longitudes
Based on the original coordinates in p_longitude, we define p_def_adapLongitude to shift points by 360° whenever they fall outside the current viewport range.
 1Parameter p_def_adapLongitude {
 2    IndexDomain: i_loc;
 3    Definition: {
 4        if p_longitude(i_loc) < ( p_centerLon - 180 ) then
 5            p_longitude(i_loc) + 360
 6        elseif p_longitude(i_loc) > ( p_centerLon + 180 ) then
 7            p_longitude(i_loc) - 360
 8        else
 9            p_longitude(i_loc)
10        endif
11    }
12}
In the Map widget, the longitude property for your nodes should now point to p_def_adapLongitude.
Step 2 - Controlling Arc Visibility
To avoid drawing “wrap-around” lines that shouldn’t be visible, we filter the connections. If the distance between two adapted longitudes exceeds 250°, the arc is hidden.
1Parameter p_def_adapVisibleArc {
2    IndexDomain: (i_loc_from, i_loc_to);
3    Definition: {
4        p_def_visibleArc(i_loc_from, i_loc_to) $
5            (abs(p_def_adapLongitude(i_loc_from) - p_def_adapLongitude(i_loc_to)) < 250)
6    }
7}
Finally, specify p_def_adapVisibleArc as the data source for the arcs in your Map widget.